SUM: The Foundation of Every Great Financial Model

59% of all excel formulas in high-quality financial models were driven by the SUM function based on the PPS analysis of 100 + best-practice models, 2019 – 2025.
The Excel SUM function is the most widely used formula across all types of financial models – and for good reason. It is not an advanced formula, but its dominance is no coincidence: simplicity is one of the five pillars of best-practice modelling.
At its core, SUM adds numbers together – an elegant alternative to long strings of “+” operators. Because it’s so simple, it’s the perfect vehicle to illustrate broader modelling disciplines such as anchoring, named ranges, and the Buffer-Row Method™ – small technical habits that make models more reliable, scalable, and auditable.
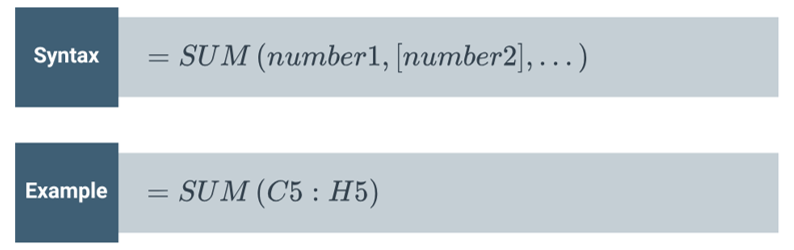
How to Use the SUM Function in Excel Financial Models
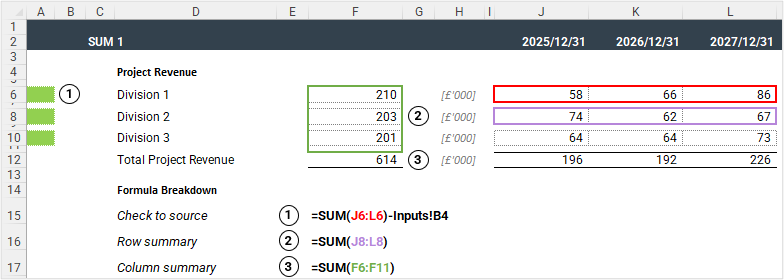
SUM can also combine multiple ranges or individual cells:

Where SUM Is Used in Financial Modelling
SUM runs through every layer of a model:
- Inputs: Aggregate raw assumptions or perform quick completeness checks. SUM is one of the few formulas acceptable on input sheets when used for validation.
- Calculations: Total revenue, operating costs, or control-account components.
- Checks: Confirm that subtotals reconcile: does the annual total equal the sum of monthly values? Do net assets equal total equity?
- Outputs & Summaries: Roll results into dashboards and decision-ready reports for investors or boards.
Function Frequency in Financial Models
SUM’s simplicity is its strength, but it’s often applied where a different formula would be more effective.
Whenever conditions are involved – such as summing by period, category, or flag – it’s time to move from SUM to SUMIFS, which we will review in our next article .
Best Practices for the Excel SUM Function in Financial Models
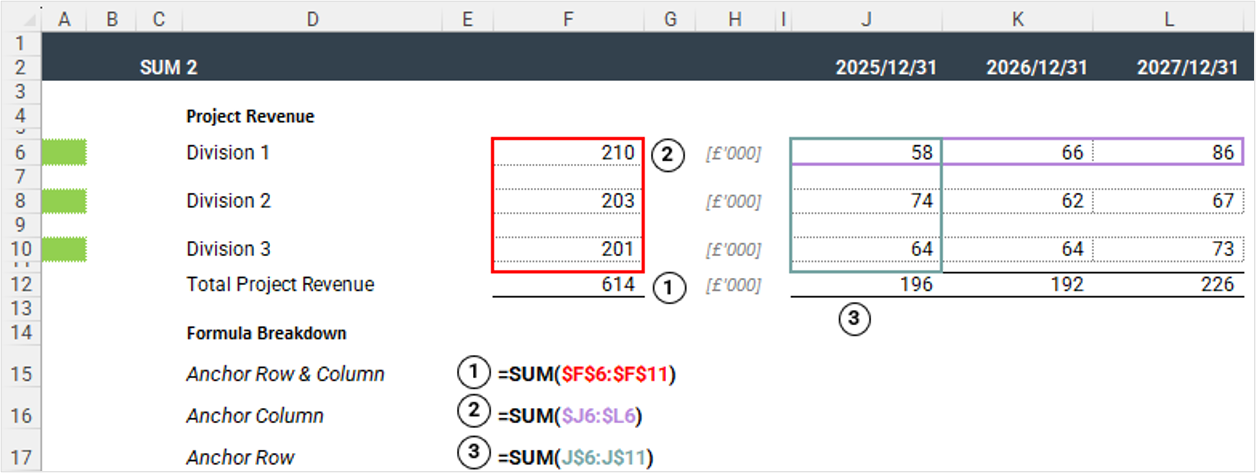
Anchor Intelligently
Anchoring controls whether a reference moves when formulas are copied. Write each formula once, then drag it.
If you want a column or row to stay fixed, use $:
=SUM($C5:$C10)
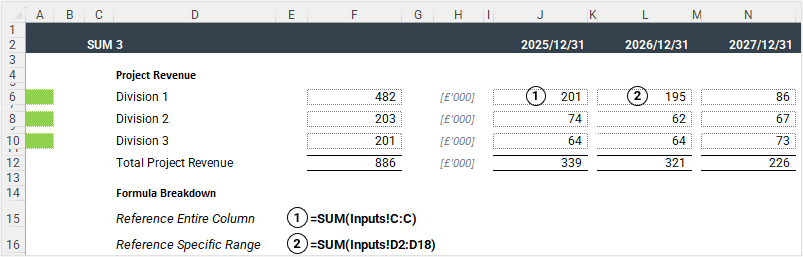
Avoid Full-Column References
Shortcuts like =SUM(A:A) force Excel to recalculate thousands of empty cells. In large models that’s a silent performance killer. When optimising Excel model performance, use precise ranges (e.g. =SUM(A5:A20)) and avoid volatile references.
Use the Buffer-Row Method™
A PPS hallmark technique. Insert a blank row between a data block and its total, and include that blank in the SUM range.
This approach keeps totals resilient as the model grows.
(See Pro Example below for a demonstration)
Position Totals Consistently
Place totals below or to the right of their inputs. A clear top-to-bottom or left-to-right flow makes models easier to follow and audit.
Common SUM Function Errors and Fixes in Excel Financial Models
- Manual additions: Typing =C5+C6+C7 instead of =SUM(C5:C7) is fragile and breaks when rows are inserted.
- Ambiguous labels: “Total” or “Sum” instead of “Total Revenue.”
- Out-of-date labels: Static text that no longer matches content. Use dynamic text: =”Total “&Block_Header

- Hidden rows: Summing over hidden data creates silent discrepancies.
- Inconsistent structure: Totals that differ across sheets complicate cross-checks and automation.
Advanced Example – How to Use the Buffer-Row Method™ for Error-Proof SUM Totals
Let’s see the Buffer-Row Method™ applied inside a real cost block.
Suppose your Operating Costs section will grow over time. A static SUM like =SUM(C5:C9) won’t include new rows.
By deliberately leaving a blank row (row 10) and referencing it –
=SUM(C5:C10)
– you future-proof the total. When new cost lines are added above the blank, Excel automatically expands the range.
Why it matters
- The buffer visually separates data from calculation – a subtle but powerful design cue in professional Excel models.
- Totals self-adjust as blocks expand.

Modellers Insight
When we audit a model, one of the first things we look for is a rogue SUM. A single = A1+B1+C1 instead of =SUM(A1:D1) tells me there may be structural issues.
Working with Other Excel Aggregation Functions
SUM is the base layer for aggregation. Other formulas extend its logic:
- SUMIF/SUMIFS – Adds conditional logic for categories, timelines, or flags.
- MAX / MIN + SUM – Applies caps or floors before aggregation.
- SUMPRODUCT – Handles weighted or matrix-based totals.
Together, these create a toolkit for financial model aggregation that balances simplicity with flexibility.
Key Takeaways
- SUM accounts for ≈ three-fifths of all formulas in best-practice models.
- Simple, universal, and essential – SUM is the quiet backbone of every great financial model.
- Use SUMIFS when conditions apply; SUMPRODUCT only when structure demands it.
- When SUM is overused, it’s not simplicity – it’s a sign your model’s structure needs tightening.
Next Up
SUMIFS – The Dynamic Aggregator Every Financial Modeller Should Master →
In closing
If your team’s Excel models contain inconsistent or opaque totals, PPS can help you standardise structure, speed, and accuracy through a Model Rebuild.
🧾 Footnote
Source: PPS analysis of anonymised professional financial models built between 2021 and 2025. Percentages reflect each function’s share among all unique formulas identified across the sample.