Excel SUMIFS in Financial Modelling: The Dynamic Aggregator Every Analyst Should Master

≈ 6 % of all Excel formulas in high-quality financial models use the excel SUMIFS function, based on the PPS analysis of 100 + best-practice models, 2019 – 2025.
While SUM may be the workhorse of every model, there comes a point when totals need logic – when we want formulas that adapt automatically as structures evolve. SUMIFS delivers exactly that – applying conditions so models respond to change without manual adjustment.
For a comparison with its predecessor, SUMIF, see our article SUMIF or SUMIFS →.
Where SUM totals everything, SUMIFS totals only what meets our criteria.
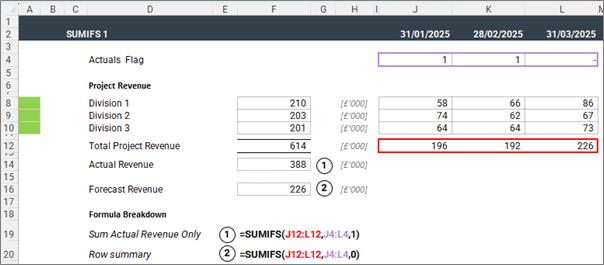
This example summarises actual and forecast revenue. As the Actuals flag changes, the summaries update automatically.
How to Use the SUMIFS in Excel Financial Models
At its core, the Excel SUMIFS function tells the model to sum only what meets defined logic. Each condition acts like a filter, ensuring only relevant data contributes to the total.

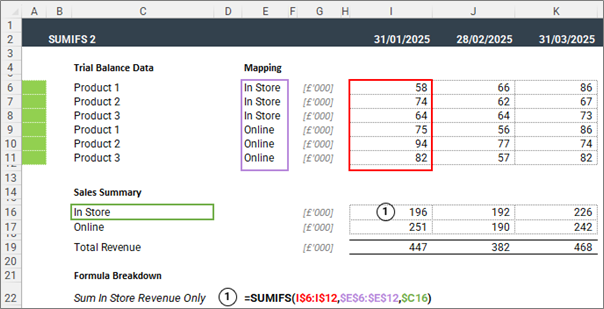
Think of it as instructing Excel: “Total only the revenue for rows labelled ‘Online’ – ignore everything else.”
One line replaces an entire pivot table and keeps the logic visible in-cell. Unlike SUM, which only adds up cells, SUMIFS evaluates every row before it agrees to include it. This is important for models with many dimensions or reporting layers.
Where SUMIFS Is Used in Financial Modelling
SUMIFS is one of the few functions that adapts as a model grows.
Instead of pointing to fixed cells, it draws totals from logic – aggregating data by rules rather than layout.
That flexibility makes it a cornerstone of structured, scalable modelling.
Common applications include:
- Mapping Inputs: Transform a dense trial balance or dataset into a structured base for forecasting.
- Timelines & Periods: Aggregate monthly results into financial years or actuals and forecasts into a single dynamic view.
- Variance Analysis: Capture actuals versus budget automatically, driven by flags or control cells.
- Tax and Compliance: Include only deductible or compliant items within the relevant schedules.
- Portfolio & Transaction Analysis: Summarise by deal, fund, or region using one consistent formula across all entities.
- Summarising Outputs: Present annual or consolidated results based on detailed monthly calculations.
- Checks & Controls: Reconcile key totals, such as ensuring total debt equals the sum of active tranches.
In practice, SUMIFS removes the need to rewrite formulas when structures change.
Totals stay aligned with business logic rather than sheet position – one reason it appears so frequently in professional models.
When Not to Use SUMIFS – and What to Use Instead
SUMIFS is powerful, but not universal. It can also be an overkill. If you are doing a simple contiguous total, opt for the SUM function. If you know that there is only a single value with the relevant criteria, go for the XLOOKUP or INDEX/MATCH combo.
Remember, using a more powerful function than required may not make a huge difference in a few places, but that mentality can lead to thousands of instances of harder-working functions that add serious calculation overhead and size to your financial model.
How Professional Modellers Get the Most from SUMIFS in Financial Models
Anchor Intelligently Across Timelines
When dragging formulas horizontally across months or vertically across accounts, anchor condition ranges so they don’t drift:
=SUMIFS($C:$C, $A:$A, “Revenue”, $B:$B, $E$1)
This way, you have one unique function that is copied across an entire block.
Don’t be limited to exact matches as conditions
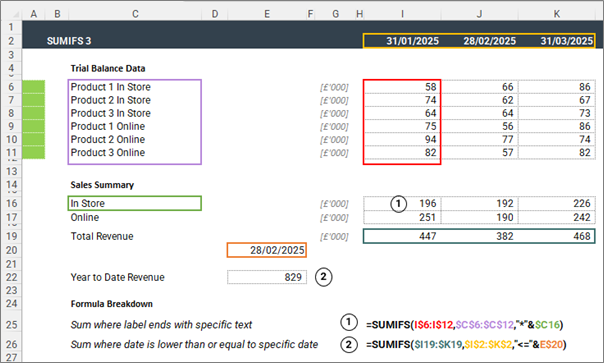
You can use mathematical operators as well as wildcards. In the below screenshot, example 1 sums Revenue where the label ends with ‘In Store’.
Keep Criteria Centralised
Separation of inputs and calculations is one of our five best practice principles. Reference criteria (e.g., period, scenario, division) from single control cells or lookup tables, not embedded text.
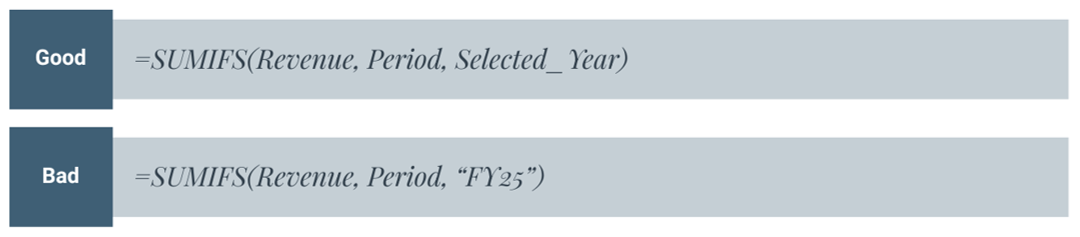
Centralised flags make model-wide scenario switches instantaneous and auditable.
Create Unique Identifiers
You can have multiple columns as criteria, but it’s not always necessary. You can keep your formulas short and calculation fast by referencing a single column with a composite identifier.
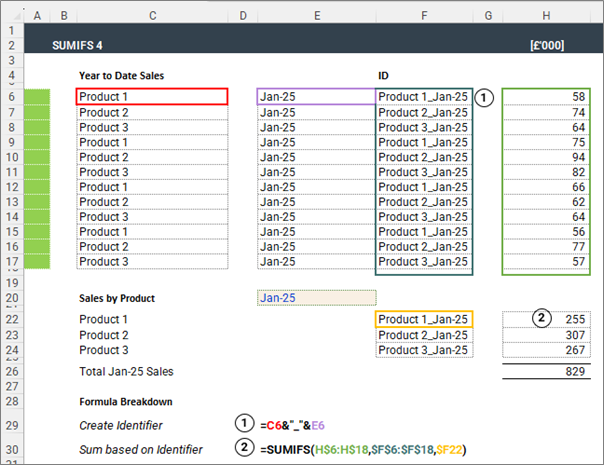
PPS tip – Try to use the same column for all unique identifiers in your model.
Reference only required ranges
The temptation when using SUMIFS is to apply it to a large range of cells for easier copying elsewhere. But it does make tracing the result back difficult, so we recommend limiting the range being referenced.
Common SUMIFS Function Errors and Troubleshooting in Excel
- Mismatched range sizes: Make sure that sum_range and criteria_range have identical dimensions.
- Multiple SUMIFS in the same cell: If one instance can’t incorporate all the data you need, separate the logic out into helper cells, and then consolidate them with a simple SUM.
- SUMIFS not capturing new data: Rather than referring to the whole, use the Buffer-Row Method (link at the bottom to explanation in our SUM article) – and ensure new data is inserted above the buffer row/column.
Working with Other Excel Aggregation Functions
Once you are comfortable with SUMIFS – you can easily work with AVERAGIFS and COUNTIFS – as the conditional logic is the same – only the mathematical operation changes – i.e averaging/counting instead of summing.
SUMPRODUCT is a heavyweight alternative to the SUMIFS function, useful when you need to sum values from a grid with criteria across rows and columns.
PPS Review
- SUMIFS accounts for ≈ 6% of all formulas in best-practice models.
- It replaces multiple ad-hoc SUMs and nested IFs with clear, auditable logic.
- Always anchor, name, and buffer your ranges.
- Keep criteria centralised and explicit.
- When structure demands complexity, graduate to SUMPRODUCT – not stacked IFs.
Once you understand the Excel SUMIFS formula, you’ll see how it connects directly to related aggregation functions like SUM, SUMPRODUCT, and AVERAGEIFS – each with a specific role in professional financial model.
For a refresher on techniques that keep these formulas error-free, revisit Five Steps to Error-Proof Your Model.
Next Up
If your model’s totals depend on hard-coded ranges or manual filters, PPS can help you standardise conditional aggregation and improve transparency.
Book a Model Review→
Footnote
Source: PPS analysis of anonymised professional financial models built between 2021 and 2025.Percentages reflect each function’s share among all unique formulas identified across the sample.
For syntax details, see Microsoft’s official Excel documentation: SUMIFS function – Microsoft Support