How to Model Inflation?

Inflation is very important in financial modelling. It’s an area that creeps into many models, whether they are integrated financial statements, or component/sub models. It’s another area that looks simple, but one that holds many subtleties which can throw your results out of kilter, so learning how to model inflation correctly is essential to the success of your financial model.
There’s nothing worse than consolidating an entire suite of models only to find out that everybody modelled inflation slightly differently. In this post, we will look at the basics of best practice inflation modelling.
How to Model Inflation: The Theory
Before we dive into the modelling, let’s have a brief overview of the theory.
As individuals, we usually hear about inflation when one of our utility providers sends us a letter to remind us that it’s that special time of year where they get to increase their prices in line with inflation.
In a business or investment context, inflation can have far reaching implications. Some businesses rely on inflation to increase their profit margin, by boosting prices while controlling their costs.
Employers usually plan wage increases relative to a given type of inflation, for example the Retail Price Index (RPI).
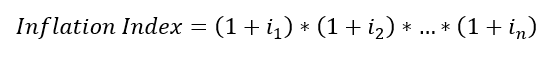
The first step when inflating involves calculating an index for a given period n, where i is the rate of inflation in period n.
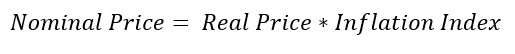
We then multiply our real price (value without inflation) by that index to get to our nominal price (value with inflation).
There are a number of choices to be made when calculating inflation, the most important of which is the choice of which index to use. The retail price index is common in the UK, but there are many variations out there that might be appropriate for different cost types.
The next complexity comes into play when we start modelling on a timeline where the periods are not equal to one year. This is because we need to start thinking about when and how we inflate our prices.
We will look at quarterly examples, but the logic applies to any periodicity. We generally have two choices:
1. Single point application
This is where we apply inflation at a single point in time in a given year. An example of this could be the annual increase in our utilities cost. Come April, that letter is dropping through our post box, and the additional inflation is quickly leaving our bank accounts.
Below is an example of how this profile might be modelled.
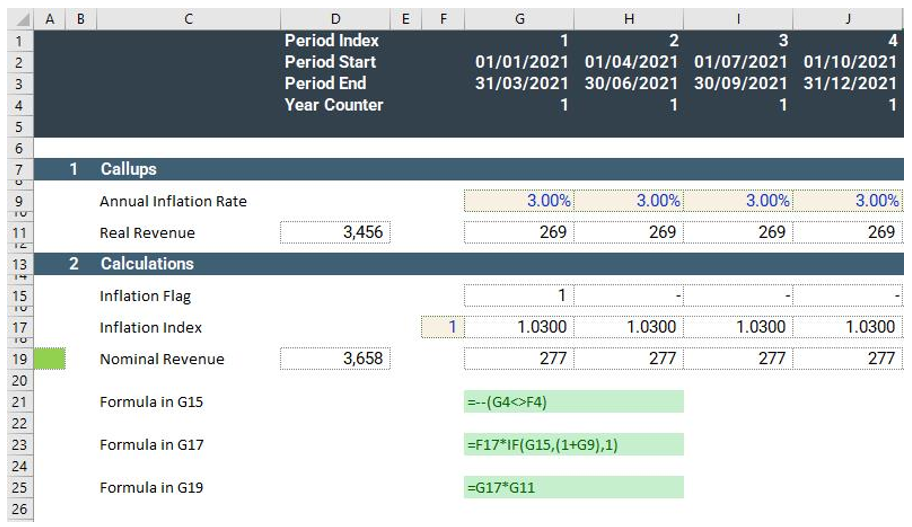
In the above, we can see that inflation is applied on the 1st of January every year. To achieve this, we use a flag, in row 15, to indicate when we have entered a new year. There is no requirement to use this date, and you might find contracts which specify any date of the year.
2. Multi point application
What if we had a contract where inflation is applied throughout the year, say at the beginning of each quarter? It’s important to understand that a quarterly rate is not the annual rate divided by four.
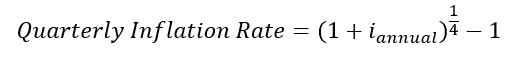
Because of the compounding effect of inflation, we need to use the above equation to derive the quarterly rate. We can use the same method to calculate monthly, weekly, or even daily inflation by substituting the 4 with 12, 52 or 365.
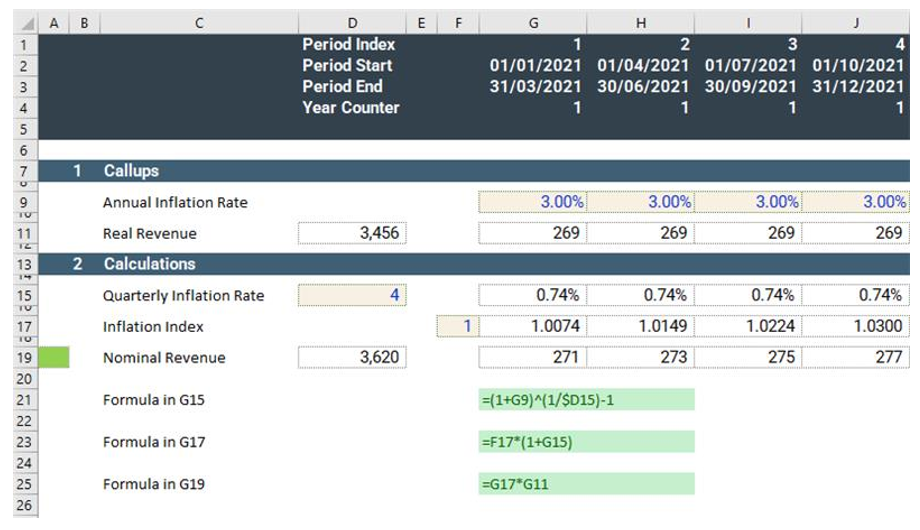
Note that we still get to the same index at the end of the year, in column J, as we did in our previous example, but the profile is not quite the same.
Inflation and its calculation methodologies are key when modelling growth as part of any budget or forecast.
Accurate inflation modelling can materially affect forecasts. Explore our financial modelling services to see how we support forward-looking scenario planning and analysis.