NPV and XNPV – When should we use the Excel functions?
The NPV or Net Present Value of cashflows is a key metric in investment appraisal. It lets us look at the cashflows of a given project after accounting for the time-value of money, which means we have to think of future money in today’s terms. Receiving £100 in five years’ time, is worth less than receiving £100 today.

Excel has some built-in functions which can do the work for us, and in this blog, we will outline why they can give different answers, and ask whether we should use them at all.
First, we’ll start with some of the theory behind the functions, and then move on to evaluating each of the following methods.
- XNPV function.
- NPV function.
- NPV calculation without using built in functions.
The Theory

The above equation says that for each period, we discount the cashflow (CF), by dividing it by a discount factor, which is driven by the discount rate r, and the period number n. We then sum all of those to get to the net present value of our cash flows.
1. XNPV Function
The XNPV function takes three arguments:
This function is often touted as the more accurate of the NPV related functions within Excel because it discounts based on specific dates and doesn’t assume equal intervals between cashflows.
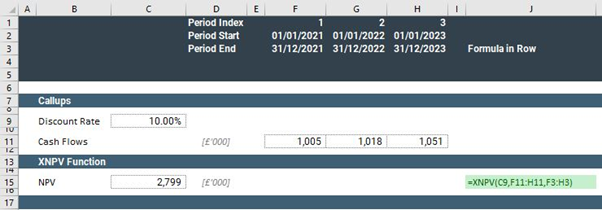
However, one overlooked aspect of this function is that it doesn’t discount the value in the first period.
This means that the assumption is that cash is received at the beginning of that first period, which is rarely the case. Therefore, it is possible that the XNPV function will overstate the NPV of your cashflows. In the above example, the 1,005 in column F is not being discounted to get to the NPV of 2,799.
If you do wish to make the XNPV function discount values in your first period, you will need to add a period zero first, and set the cashflow in this period equal to zero.

Note that we have inserted a year with zero cash flows, and the resulting NPV has now reduced to 2,545, because the 1,005 is correctly being discounted.
2. NPV Function
NPV(rate, value1, value2,…)
The NPV function takes a minimum of two arguments:
- a discount rate as a percentage, and
- either a single range containing values, or separate references to different ranges containing values.
This function is simpler to understand as it assumes standard intervals between cashflows, and it discounts each period, including the first, accordingly.
However, you must be sure to provide it with the relevant discount rate. An annual model will work if you provide the annual discount rate, a quarterly model will require a quarterly discount rate.
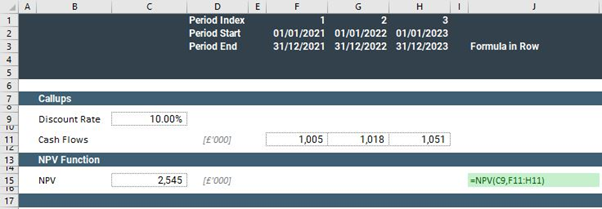
Note that we arrive at the same NPV as we did in our second XNPV example, without the additional column.
3. Excel Function Free Method
This method includes the following steps:
- calculating a distinct discount factor for each period,
- applying it to individual cashflows to arrive at the present value of each cashflow, and
- summing the above present values to arrive at the overall NPV.
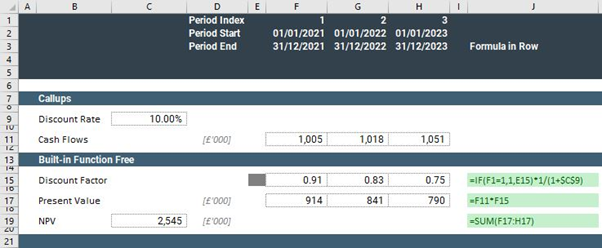
In this example, you can see that we get to the same NPV as we did with the built-in NPV function.
However, our discount factor calculation clearly shows us when the discounting is taking place, and we get the added benefit of seeing the present value in each period.
If our periodicity were to change from annual to quarterly, this method would be the most likely to reveal that our calculations need adjusting to reflect this change.
This technique is more involved, but it gives you better insight into the workings behind the number, and hence, more control.
It reduces the risk of potential errors when using functions with built-in assumptions, as with the XNPV and NPV.
An additional benefit is that you can change your discount rate in each period, if necessary.
The Takeaway
Sometimes, we need visibility over the mechanics, and without breaking out our calculations into steps, we can’t have that.
This is because built-in functions can have embedded assumptions, and these may reduce the flexibility and transparency of our model.
We’ve looked at some simple examples, but it doesn’t take a lot of imagination to see how this problem could have a major impact on decision making.
Using built in functions can be useful, but we need to understand the logic going on in the background before we rely on our results.
If you would like some guidance or training on your Excel financial modelling, contact us today at info@pps.financial.
Selecting the right valuation logic is important for investment decisions. Learn how our financial modelling services can help you standardise and validate valuation logic.